 Felix' Ramblings Felix' Ramblings
(Spoiler: The deception part was entirely on me, and not on git itself)
For fun, I'm (still in the process of) creating a simple-ish version control system. I'm taking a lot of shortcuts:
main
I also have a simple version of git status:
void: ~/devel|main *?
> ./build/vc_client status
 Added:
   test_file
 Modified:
   build/vc_client_debug
   build/vc_convert_from_git_debug
   build/vc_server_debug
   build/vc_virtual_debug
 Removed:
   TEST2
   TEST3
The implementation is straight forward:
file_list consists of user-paths and hashes of the filefile_list of the last checkpoint/commitfile_list (read & hash all files)After checking in the toolchain and fixing some bugs and obvious performance issues [0], I was pretty happy with the code, but the performance was not as good as I expected:
void: ~/devel|main *?
> find . -type f -not -path "./.git/*" -not -path "./.vc/*" | wc -l
16684

void: ~/devel|main *?
> du -sh . --exclude=.git --exclude=.vc
1.3G	.

void: ~/devel|main *?
> time ./build/vc_client status
 Added:
   test_file
 Modified:
   build/vc_client_debug
   build/vc_client
   build/vc_convert_from_git_debug
   build/vc_convert_from_git
   build/vc_server_debug
   build/vc_virtual_debug
 Removed:
   TEST2
   TEST3

________________________________________________________
Executed in  293.65 millis    fish           external
   usr time   65.55 millis    0.00 micros   65.55 millis
   sys time  226.99 millis  568.00 micros  226.42 millis
300ms is a noticable delay. Obviously the fact that the toolchain directory is >1GiB is at fault here, but I was expecting better performance due to my experience with git:
void: ~/devel|main *?
> time git status

[...]

________________________________________________________
Executed in   23.86 millis    fish           external
   usr time   19.18 millis  445.00 micros   18.74 millis
   sys time   41.84 millis  118.00 micros   41.72 millis
24ms vs 300ms does feel a lot more responsive. But looking at the profiler, most of the time of my software was spent in reading files. What is git doing to be that much faster?
First stop was ctime, also mentioned in git-update-index. In simple terms, git hashes files only when necessary (e.g. when modified since it last looked at it). The strategy is simple enough:
We can get the file properties via stat / fstat / lstat:
> man 3type stat

[...]
           struct timespec  st_atim;  /* Time of last access */
           struct timespec  st_mtim;  /* Time of last modification */
           struct timespec  st_ctim;  /* Time of last status change */
[...]
One incredibly stupid cache later (I'm just linearly searching through a list, but good enough for now I guess), and the results look better:
void: ~/devel|main *?
> time ./build/vc_client status
 Added:
   test_file
 Modified:
   build/vc_client_debug
   build/vc_client
   build/vc_convert_from_git_debug
   build/vc_convert_from_git
   build/vc_server_debug
   build/vc_virtual_debug
 Removed:
   TEST2
   TEST3

________________________________________________________
Executed in  126.04 millis    fish           external
   usr time   91.65 millis    7.79 millis   83.86 millis
   sys time   46.62 millis    5.68 millis   40.94 milli
Better, but still 100ms slower than git. Another look at the profiler reveals: My linear search as a look-up is, in fact, dogshit. Fine for now; but how fast is git when it comes to hashing files?
This was purely a question out of curiosity, and I thought this would be quick to answer. And it probably would be, under normal circumstances.
I'm using a fast (but non-cryptographic) hash. The hash function used by git is stronger, but it should be slower. If I understand everything correctly, we should be easily able to force git to re-compute the hashes by fucking with the ctime. I created a separate directory for testing, just to be sure I don't ruin my git stuff:
void: ~
> cp -r devel devel_temp
Then re-touch all files; this should update the timestamps, tank the performance of the next run, and show how much faster my simplified software is!
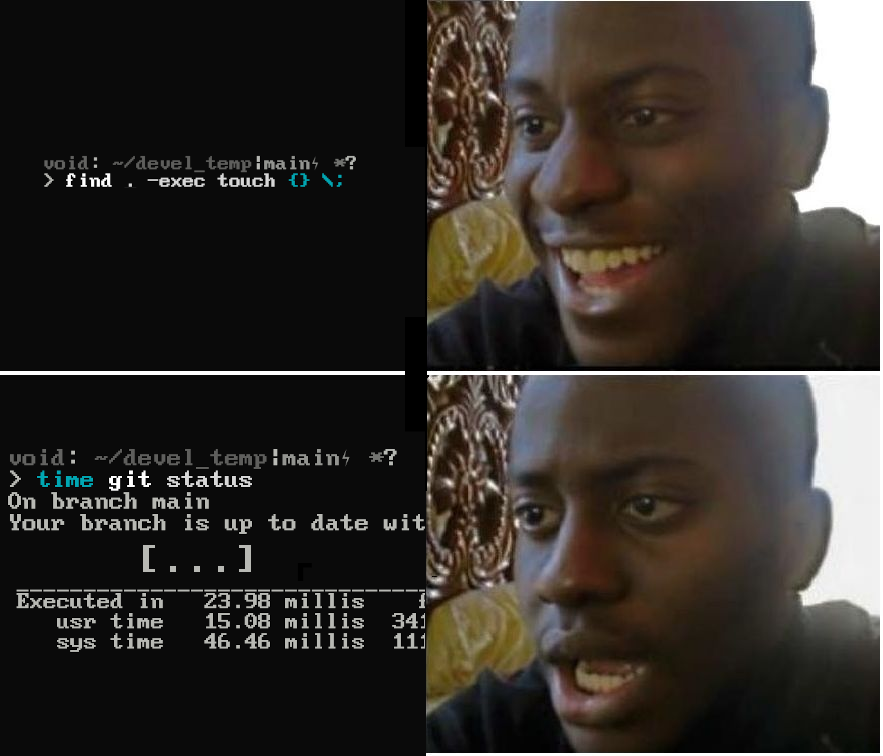
Okay, maybe I misunderstood something. I start looking through the
docs
more, and fiddle around with core.checkStat and core.trustctime. No changes.
I look through git update-index,
try to get slow performance with --refresh / --really-refresh. No changes.
I find fsmonitor - maybe there is a daemon running the background, sneakily updating the index?
void: ~/devel_temp|main *?
> git fsmonitor--daemon status
fsmonitor-daemon is not watching '/home/void/devel_temp'
Okay, what is git doing then? I know git is open-source, but I wanted to see if I'm missing
any fancy systemcalls, so I thought strace would help me identify what's going on:
void: ~/devel_temp|main *?
> find . -exec touch {} \;

[ ... wait a bit ... ]

void: ~/devel_temp|main *?
> strace -e trace=%process,%file -c git status

[ ... ]

% time     seconds  usecs/call     calls    errors syscall
------ ----------- ----------- --------- --------- ----------------
 64.16    0.006098           3      1526       360 openat
 25.70    0.002443         122        20           clone3
  7.52    0.000715           2       285       249 newfstatat
  1.90    0.000181         181         1           execve
  0.54    0.000051           2        18         6 access
  0.13    0.000012           1         7           getcwd
  0.04    0.000004           4         1           chdir
  0.00    0.000000           0         1           unlink
  0.00    0.000000           0         1         1 readlink
------ ----------- ----------- --------- --------- ----------------
100.00    0.009504           5      1860       616 total
openat should be opening a file, and the man pages say that
newfstatat is the underlying system call of fstatat, which should
essentially provide the same info as stat / fstat / lstat.
The number of system calls is way too low for the amount of files.
However, there is the clone3 - perhaps multithreading is the solution to all my problems?
Let's re-try with -f (--follow-forks):
void: ~/devel|main *?
> find . -exec touch {} \;

[ ... wait a bit ... ]

void: ~/devel|main *?
> strace -f -e trace=%process,%file -c git st

[ ... ]

% time     seconds  usecs/call     calls    errors syscall
------ ----------- ----------- --------- --------- ----------------
 87.28    1.230397          66     18391       261 newfstatat
 12.13    0.171054      171054         1           wait4
  0.36    0.005124           3      1545       360 openat
  0.17    0.002434         121        20           clone3
  0.03    0.000385         192         2           execve
  0.01    0.000141           4        34        10 access
  0.00    0.000065          65         1           clone
  0.00    0.000035           3        10           getcwd
  0.00    0.000033          33         1           unlink
  0.00    0.000006           6         1           chdir
  0.00    0.000005           5         1         1 readlink
------ ----------- ----------- --------- --------- ----------------
100.00    1.409679          70     20007       632 total
Observations:
newfstatat: This is more than the amount of files in the repo,
so most likely it's going over all files.ctime-cache,
I just need to replace my linear search.clone3:file_list.openat:

It turns out that git does re-hash the files, I'm just measuring it too late. And git isn't even to blame for this; it's not being sneaky on purpose. Here is the culprit:
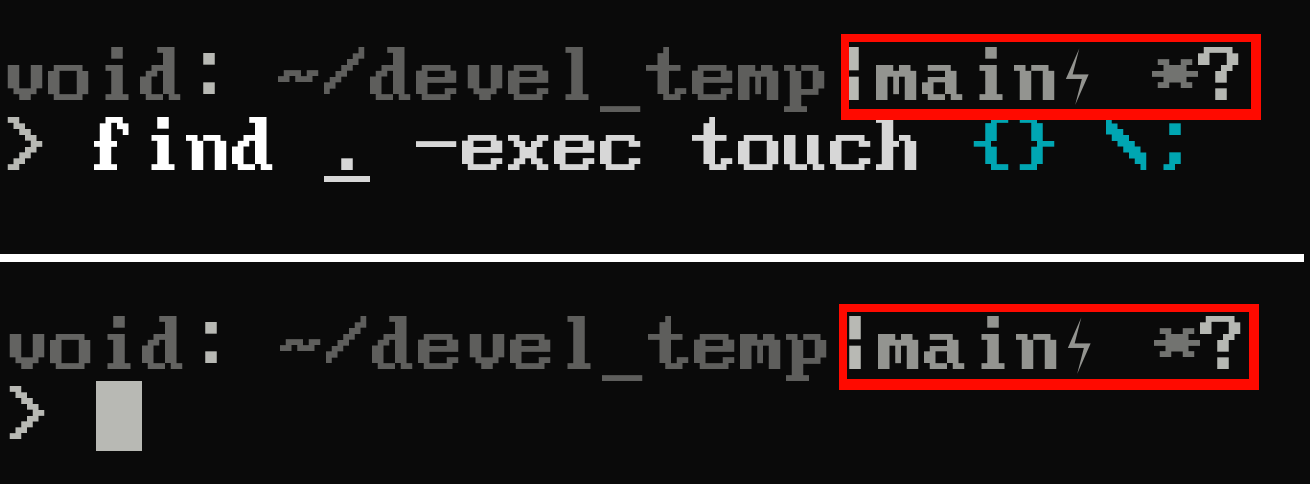
It was my fucking fish-shell.
These status indicators, which I completely ignored the entire time, come from a
git status --porcelain, as seen here.
So the entire time, the workflow was:
git status in the backgroundgit statusstat-calls, no file hashing required

So, finally, let's see git re-hashing the files by temporarily dropping into a (non-customized) bash instance:
[void@voidbox devel_temp]$ find . -exec touch {} \;
[ ... ]

[void@voidbox devel_temp]$ strace -f -e trace=%process,%file -c git status
[ ... ]
Refresh index: 100% (16938/16938), done.
[ Oh look, there's an actual output when it refreshes the index during git status ]

[ ... ]

% time     seconds  usecs/call     calls    errors syscall
------ ----------- ----------- --------- --------- ----------------
 96.95    1.284297          35     35917       249 newfstatat
  2.87    0.037977           1     19113      1374 openat
  0.16    0.002168         108        20           clone3
  0.02    0.000244         244         1           rename
  0.00    0.000035           1        22        10 access
  0.00    0.000001           0         7           getcwd
  0.00    0.000000           0         1           execve
  0.00    0.000000           0         1           chdir
  0.00    0.000000           0         1         1 readlink
------ ----------- ----------- --------- --------- ----------------
100.00    1.324722          24     55083      1634 total
19.113 calls to openat, there we go! Git is opening the files and
computing the hashes.
And here is its performance:
[void@voidbox devel_temp]$ find . -exec touch {} \;

[ ... ]

[void@voidbox devel_temp]$ time git status

[ ... ]

real	0m4.449s
user	0m4.293s
sys	  0m0.176s
And suddenly, my single-threaded 300ms doesn't seem that slow anymore :)
[0]: There were a few big ones:
read to directly place the file bytes in the correct location.
Profiling showed: Not worth it, lots of read-calls have a significant overhead.
Prefer doing one single read into a buffer, and parse stuff in-memory.[1]: I quickly multithreaded just the cache lookup (which does hash the file on a miss), and it did improve my performance to 55ms! Still need to fix the linear search though.
Felix' Ramblings